Did you see my recent mail piece about the February, 2024 market update for each neighborhood in North Bend? Check out the stats broken down by neighborhood below.
There were some key real estate trends in February across all the neighborhoods:
- It took between 7-10 days to get a home for sale North Bend under contract with a buyer
- Homes for sale in North Bend sold higher than asking price
- Supply of homes for sale in North Bend is still tight
Thinking about selling your home? Click here to see how Hailey will get the job done!
North Bend Neighborhood Updates February, 2024
Si View Real Estate Prices and Time on Market
- $489 Price Per Square Foot
- 8 Homes Sold
- 7 Days on Market
- $1,172,163 Average Price Sold
- 105% of Asking Price
- 2,480 Sqft Average Home Size
- $1,325,000 Highest Price Sold
- $835,000 Lowest Price Sold
Riverbend Real Estate Prices and Time on Market
- $462 Price Per Square Foot
- 15 Homes Sold
- 10 Days on Market
- $698,593 Average Price Sold
- 103% of Asking Price
- 1,570 Sqft Average Home Size
- $1,342,000 Highest Price Sold
- $405,000 Lowest Price Sold
Wood River Real Estate Prices and Time on Market
- $462 Price Per Square Foot
- 3 Homes Sold
- 7 Days on Market
- $1,350,000 Average Price Sold
- 106% of Asking Price
- 2,947 Sqft Average Home Size
- $1,375,000 Highest Price Sold
- $1,189,000 Lowest Price Sold
Cedar Falls Real Estate Prices and Time on Market
- $417 Price Per Square Foot
- 15 Homes Sold
- 7 Days on Market
- $1,244,885 Average Price Sold
- 102% of Asking Price
- 3,023 Sqft Average Home Size
- $1,399,880 Highest Price Sold
- $950,000 Lowest Price Sold
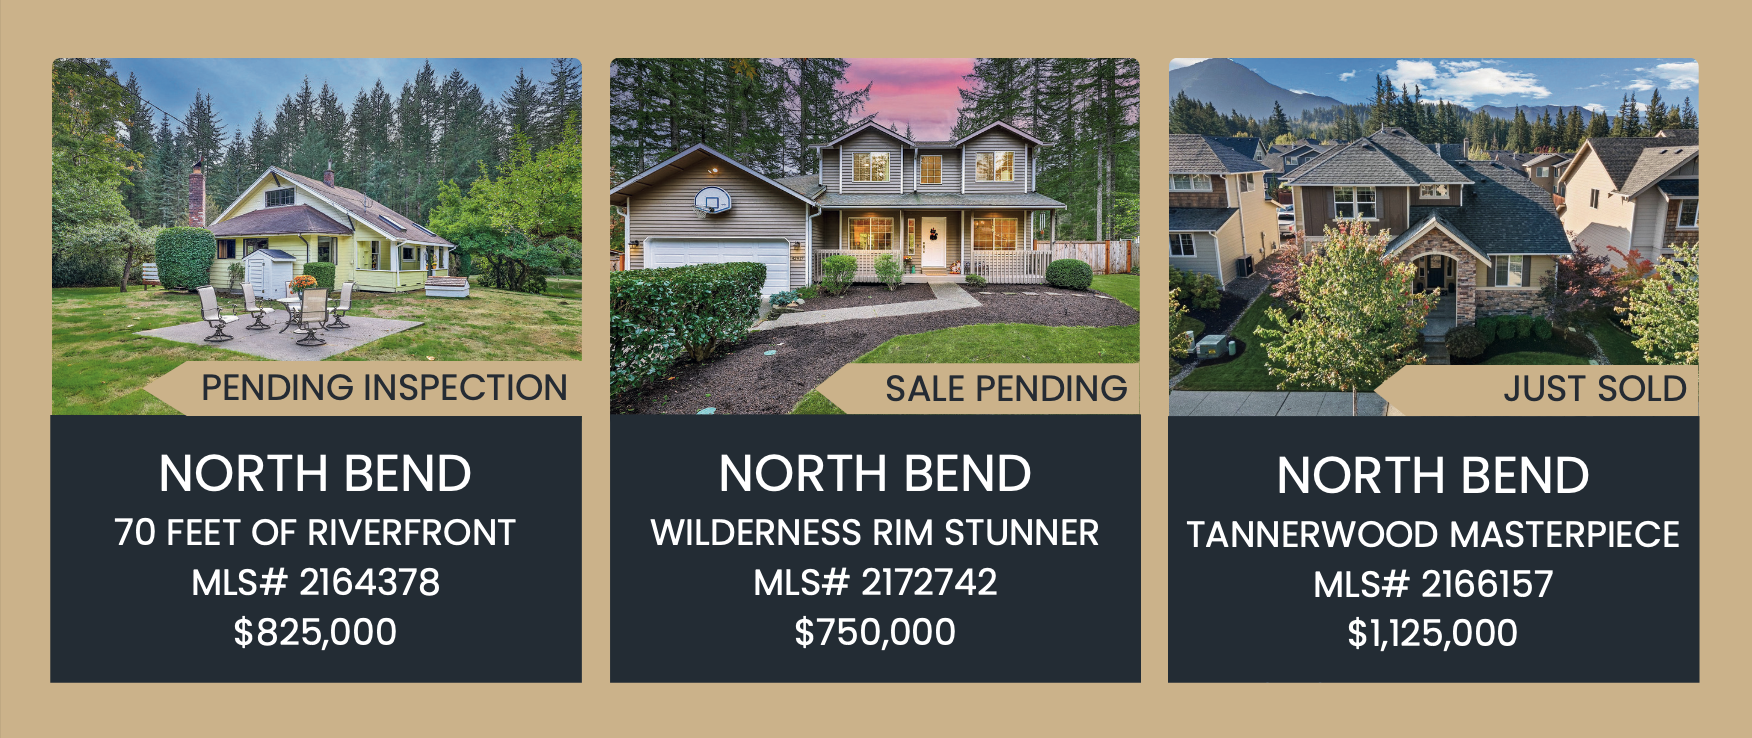
Hailey Miller's Recent North Bend Sales